Summary & key findings
- Tax haven based companies won 5 % of the value of public tenders throughout EU countries in 2006-2017.
- That yields a rough estimate of 100 bilion EUR being awarded annually to such companies.
- We examine ownership structure of 255 624 suppliers, looking for co-owners from EU black and greylisted countries.
- Most frequent ties lead to Switzerland, Bermudas, Brittish Virgin Islands, Cayman Islands and Curaçao.
- The supplied tender volume ranges between 1.3 % (Hungary) and 13.4 % (UK).
- Tax haven supplier share is gradually growing over last decade
- Remedies can be taken without a breach of EU directives.
Intro
Tax haven based companies win roughly 5 % of value of public tenders throughout EU countries. In this analysis we found about 10.000 government suppliers that are co-owned from countries like the Bermudas, Curacao or Cayman Islands - countries officially blacklisted (or greylisted) as tax havens by the EU. These companies received public tenders worth about 56 billion EUR over past 12 years, almost doubling their share of the market over the last decade. That might, however, be just a tip of an iceberg, as we reliably identified and examined only 10 % of all the suppliers, due to the low quality of data from some EU countries. The countries where we did reliably identify significant portions of tax haven suppliers are United Kingdom, Spain, Poland, Estonia, Portugal, Netherlands. To find that out, we examined data on 17 million tenders worth roughly 5 trillion EUR. This report summarises why, how and what we found. It draws on an academic working paper by Janský, Palanský & Skuhrovec (forthcoming).
Are tenders to tax havens a bad thing?
Not necessarily. But awarding a public tender - say, from the UK to a Bermuda-based company generates two risks. First, UK might lose its money due to tax avoidance as profits drift to the Bermudas instead of being taxed properly in a country where they were raised. Second, because of the deliberate opacity of corporate formation in havens, there may be hidden beneficiaries or conflict of interest in the award of such contracts. Picture a minister of transportation awarding tenders to a highway construction company that he secretly owns (that actually happened in Czechia, 2008). You don't want that to happen with your tax money, right?
Before jumping to conclusions, let’s ask if there are legitimate reasons why a government supplier should be based in Bermudas? That might make sense if the owners or production or physical owners are based there. However, due to economic size and location of the Bermudas, that should be extremely rare between EU procurement suppliers. As we will see, it is not. As stated in this report by European Parliament, presence of tax haven owners provides means to escaping taxation and hiding of beneficial owners.
Public procurement is the ideal ground, where governments can start pushing against the tax haven abuse. Not only they have additional motivation (risk of conflict of interest), but as buyer they also have a very strong leverage. Needless to say - such push rarely happens in EU (yet). Governments are typically unaware of such possibility, or their individual bodies might even consider it illegal limitation of competition.
What did we do?
In Datlab, we decided to map the size of the whole problem. Together with researchers from Universities of Cambridge and Charles University, we put together a huge pile of necessary data in order to inspect owners of as many tender suppliers in EU countries as possible. In practice, this consisted of the following steps:
- First, we obtained data on awarded public tenders from EU registry plus 17 national sources: Bulgaria, Croatia, Czechia, Estonia, France, Hungary, Ireland, Latvia, Lithuania, Netherlands, Norway, Poland, Portugal, Romania, Slovenia, Slovakia, UK. This resulted in a database of 17 million tenders since 2006 worth roughly 5 trillion EUR.
- With a very conservative approach, we matched 255 624 suppliers (10 % of all suppliers) to the probably most complete database of company ownership structures - Orbis, published by Bureau van Dijk, a Moody’s Analytics company. We left out the rest - these are tenders lacking supplier IDs, addresses or even company names.
- We then examined ownership structure chains of those suppliers up to the 20th level (owner of owner of owner etc.). That led us to identify 674.215 co-owner companies with a share in supplier companies above 10 %.
- We then cross referenced all the co-owners seats with EU tax haven black and grey listed jurisdiction. That identified 9.343 suppliers that have co-owners in tax havens (3.6 % of all identified suppliers). In this text, we call them “tax haven companies” for short.
- We counted the tenders awarded to these companies - for the detailed statistics see the next chapter.
Sounds easy to do, if you are a data geek, right? Why no one has done such analysis before? Well, it's quite a lot of work. It took about 20 man-years, mostly of expert IT and business analyst work on procurement data, to get us here. Big initial chunk has been financed through EU project DIGIWHIST. We, however, took it much further, to arrive at reliable and policy-relevant results.
Results: How big is the tax haven share?
So far we ended up with about 10.000 companies which:
- Are mostly based in EU.
- Supply public tenders in EU.
- Are co-owned from countries labeled by EU as non-cooperative economies (see Annex 2).
In terms of volume, these companies supplied tenders worth 55,6 billion EUR which is about 5,3 % of all tenders in the sample. Such share gives us a very rough estimate, that within EU, tax haven companies might receive tenders worth 100 billion EUR annually .
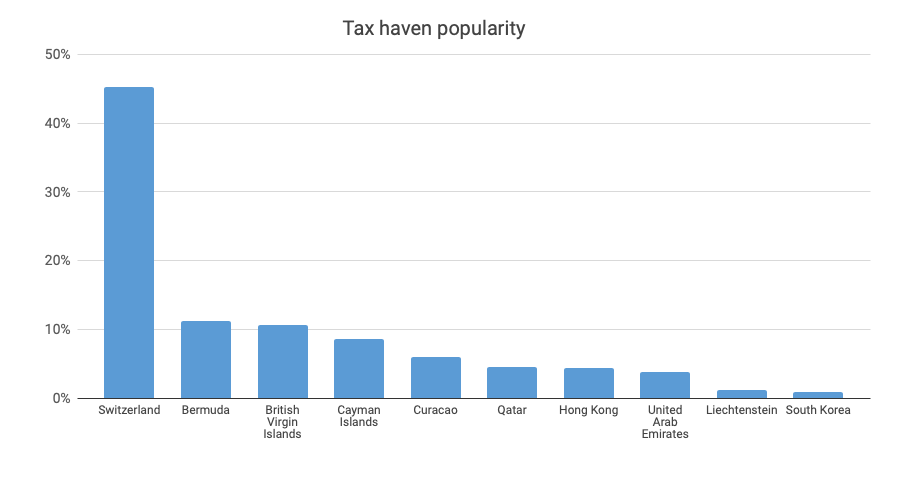
Figure 1 summarises the most frequently observed tax haven countries. We can see that the largest share is awarded to companies tied to Switzerland - which is not surprising due to its existing economic ties and location in the middle of EU. More alarming should, however, be a high frequency of ties to other countries - Hong Kong, British Virgin Islands, Bermuda, Qatar, Cayman Islands and Curacao, which jointly account for 66 % of discovered ties. As stated above, in these countries we expect increased risks of abuse for tax avoidance and hiding of conflict of interest.

Now, let us take a closer look at what exactly have we found. We started working with a sample of 2 million tenders (12% of all tenders) for which we know the supplier ownership structure. The coverage of our sample varies from country to country, as they publish the data in a different quality - both regarding procurement and ownership. The following figure shows how we got the individual countries covered.
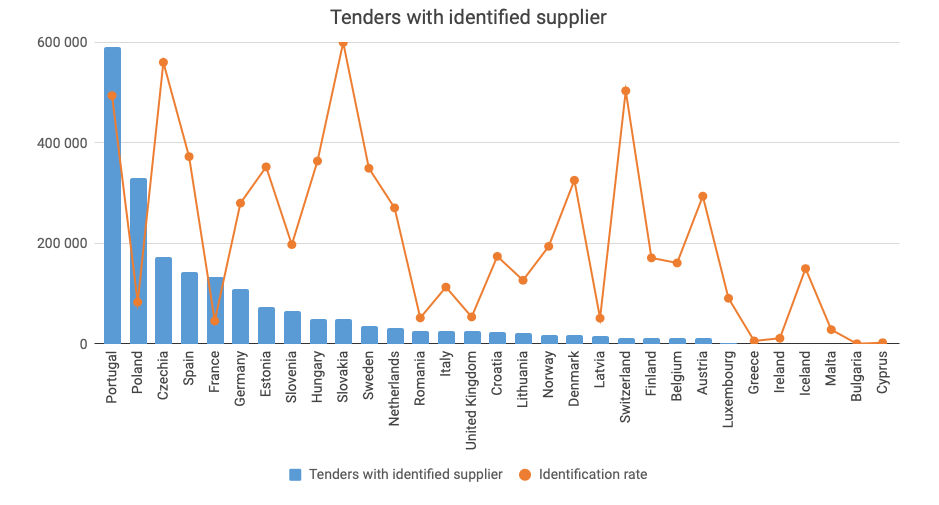

Apparently, only in some countries, the coverage is good enough to produce a relevant analysis. We chose a threshold of having at least 20.000 tenders with identified suppliers in order to produce reliable figures for such country. We thus further examined only the top 17 countries (Portugal to Lithuania in Figure 2). In these countries we can reliably identify the following shares of tax haven suppliers:
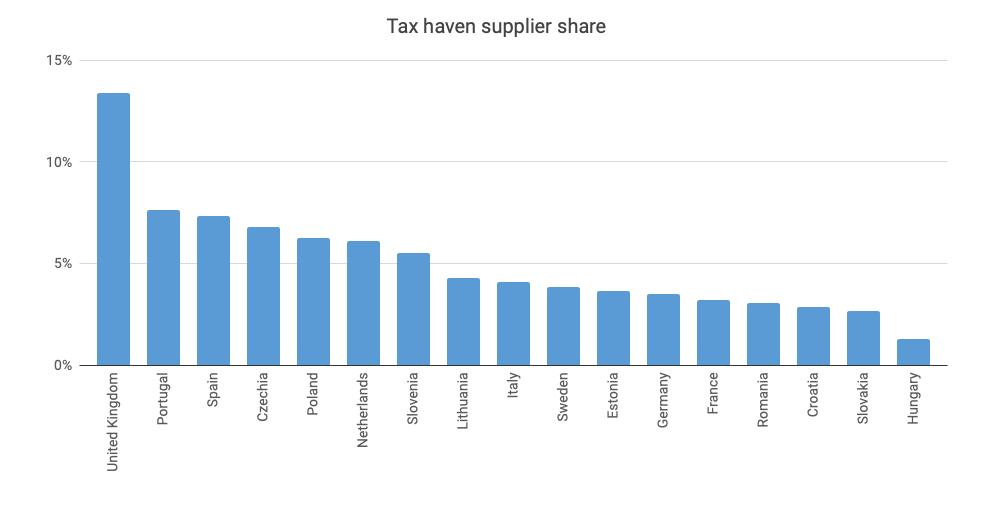

Apparently, in UK the volume going to tax haven companies is severe - 13.4 % of their value. Large portion of this volume is however given by several large tenders. Example of such could be this tender for provision of agency workforce worth 700 mil. GBP, awarded to Capita Business Services Ltd. co-owned from the Bermudas (22%), or a 554 mil. GBP tender awarded by Surrey PCT to VIRGIN CARE LIMITED company co-owned from British Virgin Islands (through a chain of 5 other companies, with an unclear ultimate share between 75 to 98 %), tender was awarded in 2012 and is only available through EC open data.
In Data Annex data you can see, that for the UK such large value share is generated by only 4 % of tenders (in terms of count) - namely 1029 out of 25.048 examined tenders have been awarded to tax haven companies.
More generally such “80:20 rule” applies for most of the countries. It is often a handful of tax haven companies accounting for a major portion of the procured money. That is merely a statistical fact, which should not obscure the main message: in all of the examined countries we identified a significant portion of tenders awarded to tax haven co-owned companies, ranging from 1.3 % (Hungary) to 13.4 % (United Kingdom).
In order to provide a more detailed view on supplier composition in individual countries, we prepared a simple visualisation:
Visualisation: Volume and share of tenders awarded to tax haven suppliers in examined countries from 2006. The figures only reflect the sample covered - real volume might thus be proportionally larger.
Should we expect more tax havens in future?
Finally, let’s take a look at the trends - after all, the reported averages are from 2006+ data in most of the countries. Are tax havens a growing problem? This is depicted by Figure 4, showing the share of tenders awarded to tax havens across all EU countries. When going back in time, we observe a mild continuous increase in the recent years - as the share of tax-haven suppliers rose by about 50 % since 2009 - we can observe that in 2017 these companies won about 5.2 % of tenders. Here we report only the tenders count, not the overall volumes, as these are less volatile in time - and enable us to see the trend more clearly (both approaches yield similar averages though).

This can’t be right
We double-checked the calculations. Then we double-checked them again. Examined a few dozens of companies manually. Everything fits - we are making no systematic error, which would cause a major bias of the results. In order to enable further checks and comparisons by other analysts, we also provide an Annex spreadsheet, where underlying aggregated data for all presented figures can be found (data on individual companies cannot be provided under current Orbis license).
It is certain though, that the results are not exact. Given the quality of the input data (wrong prices, incomplete supplier data, errors in ownership data) we do expect errors to be present, however without a strong impact on the overall results. Rigorous statistics can’t reliably be used to estimate the error scale. However, in our experience, an effect up to 10 % is not unlikely. That sounds acceptable. Whether the true volume of tenders from our sample going to tax haven companies is 58 or 62 billion EUR, does not change the main message of this report.
Much less reliable are the estimates of overall share in the economy. We examined a sample of 255 thousand suppliers. Statistically speaking, that is large enough to provide precise results - if it were a random sample. It may not be. We are working only with a sample of tenders with good data in terms of price and supplier identification. There are reasons to expect, that in such sample, tax haven companies can be both overrepresented (because bigger international companies are more likely to be present in the Orbis database) and underrepresented (because it's the tenders to shady companies, that authorities might intend to hide through worse data). Therefore the real magnitude of tax haven presence in public procurement on top of the well identified 58 billion remains uncertain - our best guess is a figure of 5 %.
Conclusion: can we ban the companies?
This study should help to stir a discussion on one possible solution to the tax haven issue. Whereas governments face difficulties in pushing back the use of tax havens in general, there is one area, where a much more direct impact can be delivered: public procurement. By refusing to award a contract to a tax haven co-owned supplier, the government may push these companies to relocate. With new anti-money laundering EU directive (launching beneficial ownership registries), this is a relatively doable task.
As this is subject to many debates, we asked European Commission to clarify if exclusion of bidder from EC-blacklisted tax haven is feasible under procurement directive. If we got a clear "no", that would imply that member states can only resort to such regulation below EU threshold (and that EU directive changes need to be made to allow for going further). We did not get such "no", but we did not get a "yes" either. The answer from EC cautiously admits the possibility to exclude a tax-haven owned company from tender. But not without giving it a chance to demonstrate, that it pays its taxes well and does not hide beneficial owners. The latter part (uncovering owners) is already partially applied in Czechia and Slovakia in recent years, the former part might take form of more scrutinised version of country-by-country reporting, commonly suggested as a remedy to tax optimisation.
The impact of such tax haven supplier ban should be very significant. Public procurement alone typically accounts for 10 - 20 % of country GDP, where the abuse of tax havens can be nearly eliminated. Such elimination should additionally spill to non-procurement sectors, further multiplying the effect. However - in order to give it a go, governments need to see that such effect makes sense in their country.
We are well aware, that some online study by a group of central-European data enthusiasts will not do the trick. What we did is an extensive pilot showing - yes, tax haven mapping can be done in most of the countries. It's the local NGOs, journalists and government themselves, who can really take our results further - and we are looking for such patners to work with. It will take further investigations, data purchases and cleaning to polish the results for any selected country. Given the money at stake, it should certainly be worth it.
How to get to these partners? This is where you, our reader, come in :). Sharing the report helps, sharing it to relevant people helps a lot. Please do that. And of course - in case of any questions, feel free to contact us.
Annex 1 - Data
Underlying data for figures are available in this google spreadsheet:
https://docs.google.com/spreadsheets/d/1cRoVNXkJMzjq1kB_BqIxRq4Qu6Y9C7yg8UNY6TKB9rk/edit
Annex 2 - Methodological notes
During the research, we made many choices, which might have affected the presented results. A different approach might produce different numbers - and we invite further researchers to challenge and improve our results. Hence we summarise several methodological choices, which we feel that made major impact on the overall results. In general, we deliberately chose more conservative data treatment options, to boost reliability and avoid extreme results. We will extend this list, based on questions we might receive, so stay tuned :).
- Tax havens list was taken from grey and black lists published by European Commission: https://ec.europa.eu/taxation_customs/sites/taxation/files/eu_list_update_25_05_2018_en.pdf
- Any company within ownership chain seated in tax haven renders the supplier as tax haven co-owned, provided that it has share over 10 % (including publicly traded companies). If more tax havens are present, one of them is chosen randomly (this happened only in ⅕ of sample, thus not creating a risk of major bias).
- Only tenders with reliable prices are included in the sample. That means prices are available, not completely unrealistic and consistent across various publications regarding single contract.
- Only tenders with reliably identified supplier are included in the sample - that means where company name, id, address and country were close enough to a single record in Orbis database (that did happen even for companies without id, as long as other records were matched sufficiently).
- Only aggregate figures are published due to Orbis license limitations. We are negotiating for an extension to provide the data to partner organisations.